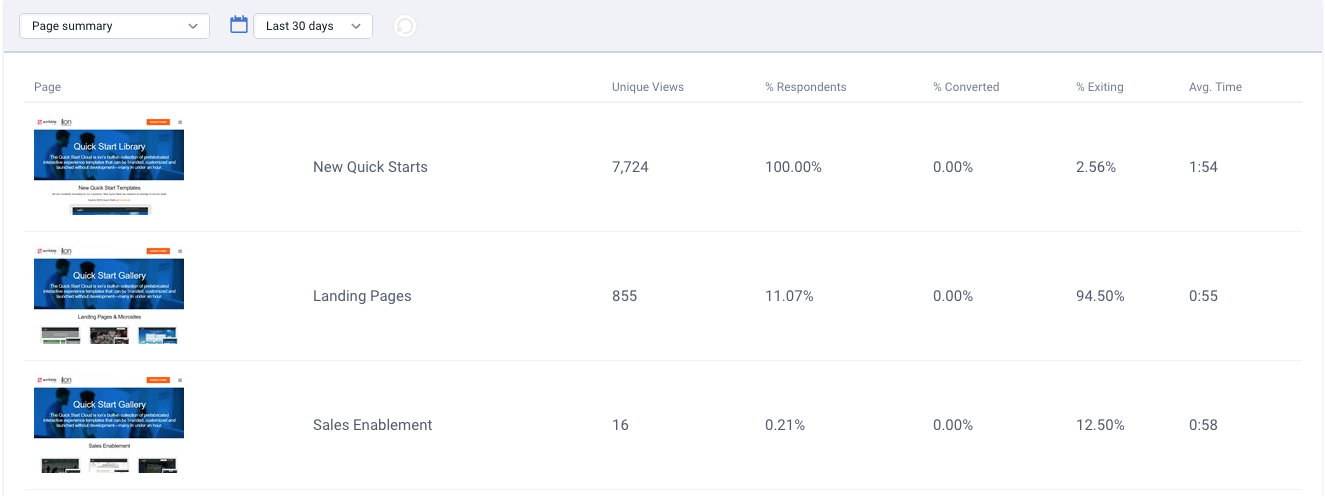
The page summary gauge shows a breakdown of traffic to each page within a given experience.
Here you will see the number of unique views to each page (within your specified time period), the percentage of the total traffic that went to that page, the percentage of respondents who converted after viewing that page, the percentage of respondents who exited after viewing that page as well as the average time spent on that page by each visitor.

You can also click each thumbnail in this gauge to go to a corresponding Page Performance tab where you will be able to review a page views chart, segment pie chart and a page element summary for that specific page.


Social Profiles